(2015年の過去記事)
ROOTでヒストグラムを書くと、デフォルトだと右上にそのヒストグラムに関する情報が書かれた箱ができる(名前がわからない・・・・)
今回2つのヒストグラムを重ね書きするグラフを書いてみて、その箱に関する情報だけでは不足なので新しく、TLegendというのを導入してみた
つまり↓
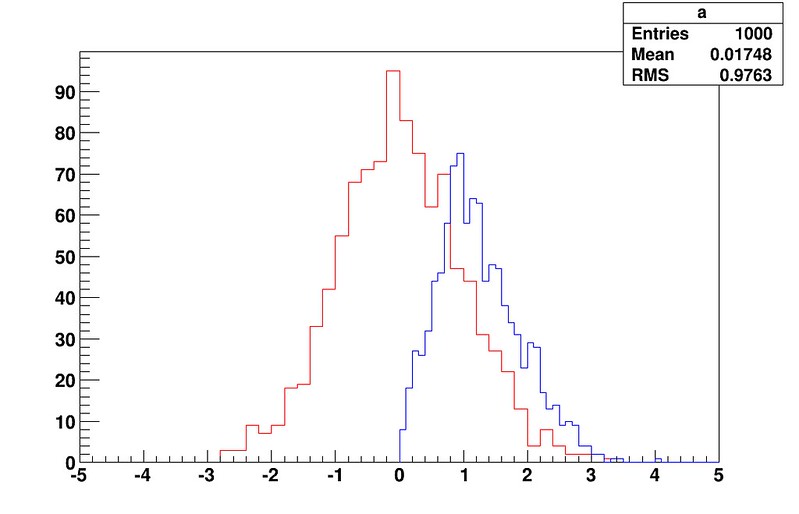
では微妙で
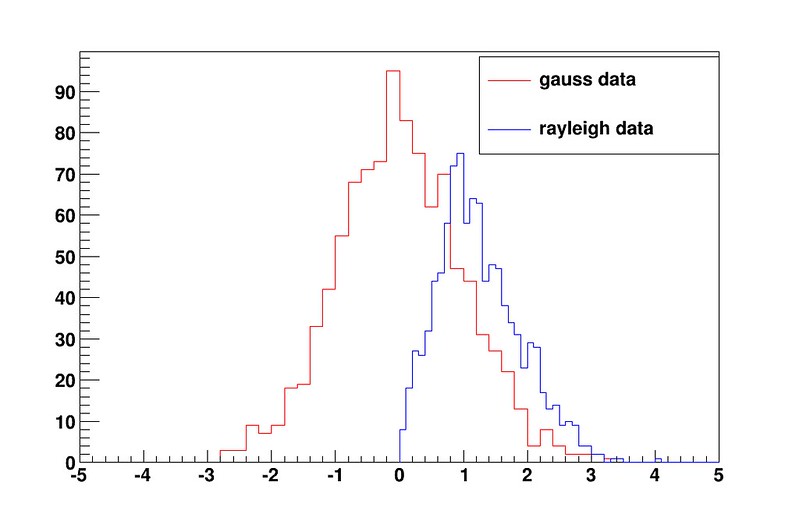
こんなのがが欲しい↓
ソースコードはこんな感じ(こんな感じで良いのかわからんけど、ひとまずかけているから良し、で・・・)
{
#include <fstream.h>
#include <string.h>
#include <TMath.h>
TCanvas *c1 = new TCanvas("name", "title", 0, 0, 1080, 720);
gROOT->SetStyle("Plain");
char fname_mic[80] = "data_gauss.txt";
char fname_mic_bg[80] = "data_rayleigh.txt";
char fname_picture[80] = "result_for_blog.png";
Int_t nbin = 50;
Double_t mic, mic_bg;
Double_t x, y;
TH1D *h1 = new TH1D("a", "", nbin, -5, 5);
TH1D *h2 = new TH1D("b", "", nbin, 0, 5);
ifstream fp(fname_mic);
while(fp >> x){
h1 -> Fill(x);
}
fp.close();
ifstream fp(fname_mic_bg);
while(fp >> y){
h2 -> Fill(y);
}
fp.close();
// set y maximum
//h2 -> SetMaximum(40);
// show histogram
h1 -> SetLineColor(2);
h1 -> Draw();
h2 -> SetLineColor(4);
h2 -> Draw("Same");
// remove right profile box
gStyle->SetOptStat(0);
// set TLegend
leg = new TLegend(0.6, 0.7, 0.9, 0.89, "Legend");
leg->SetFillStyle(0); // or leg->SetFillColor(0); // white paint
leg->SetTextSize(0.04);
leg->SetHeader("The Legend Title");
leg->AddEntry(h1, "gauss data","fl");
leg->AddEntry(h2, "rayleigh data", "lf");
leg->Draw();
c1.Print(fname_picture);
exit(0);
}
■ ソースコードの簡単な説明
右上にあった箱を非表示にする
gStyle->SetOptStat(0);
TLegend(0.6, 0.7, 0.9, 0.89);
の後の4つの引数はそれぞれxmin, ymin, xmax, ymaxに相当
値はそれぞれ
グラフの左上の軸の交点が(0, 0)
グラフの左下の軸の交点が(0, 1)
グラフの右下の軸の交点が(1, 0)
グラフの左下の軸の交点が(1, 1)
ただしおそらくこれでは不足に思うと思う
なぜなら、デフォルトのフォントが小さいから
leg->SetTextSize(0.04);
で調整する
これをいじると、軸の外にもLegendが出てくれるようになる
leg = new TLegend(0.6, 0.7, 0.9, 0.89, "Legend");
の最後の引数はLegendのタイトル
下のような方法でも後付け可能
leg->SetHeader("The Legend Title");
でタイトルが付けられる
leg->AddEntry(h1, "gauss data","f");
leg->AddEntry(h2, "rayleigh data", "f");
leg->Draw();
で、Legendをセットして、描画する
AddEntryの第3引数は
L: draw line associated with TAttLine if obj inherits from TAttLine
P: draw polymarker associated with TAttMarker if obj inherits from TAttMarker
F: draw a box with fill associated wit TAttFill if obj inherits TAttFill
E: draw vertical error bar if option "L" is also specified
みたいな選択肢があるらしい
参考 :
class TLegend: public TPave, public TAttText
また箱の色がデフォルトでは灰色なので、白く、もしくは透明にしておく
透明にする場合
leg->SetFillStyle(0);
白塗りする場合
leg->SetFillColor(0);
ちなみに、ここで使っているデータはGSLがインストールされていれば簡単に再現できるだろう
gsl-randist 0 1000 gaussian 1 > data_gauss.txt
gsl-randist 0 1000 rayleigh 1 > data_rayleigh.txt
でOK
GSLをデフォルトの場所にインストールしていれば
/usr/local/bin/gsl-randist
があるはず
グラフからわかる結果や数値などをTLegentでグラフ内に書きたい場合は、AddEntryでグラフの各データとテキストを紐づけすることはできない
そういうときは
これが嫌な場合は